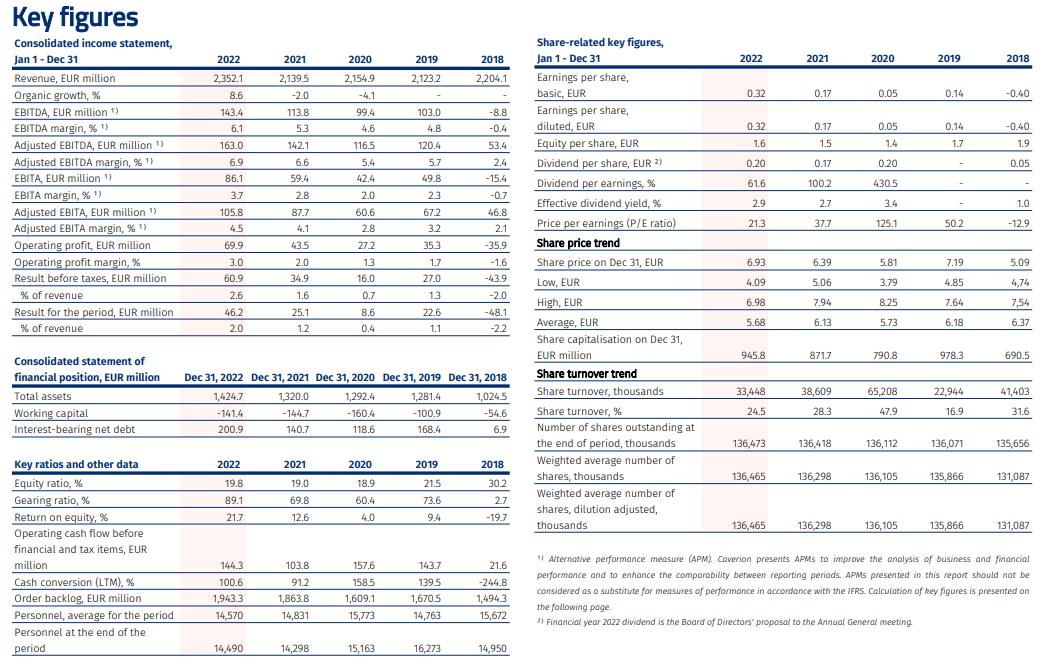
Key figures and their definitions
Key figures

Calculation of key figures
|
EBITDA |
= |
Operating profit (EBIT) + depreciation, amortisation and impairment |
|
Adjusted EBITDA |
= |
EBITDA before items affecting comparability (IAC) * |
|
EBITA |
= |
Operating profit (EBIT) + amortisation and impairment |
|
Adjusted EBITA |
= |
EBITA before items affecting comparability (IAC) * |
|
Working capital |
= |
Inventories + trade and POC receivables + other current receivables - trade and POC payables - other current payables - advances received - current provisions |
|
Interest-bearing net debt |
= |
Interest-bearing liabilities - cash and cash equivalents |
|
Equity ratio (%) |
= |
Equity + non-controlling interest x 100 Total assets - advances received |
|
Gearing ratio (%) |
= |
Interest-bearing liabilities - cash and cash equivalents x 100 Shareholder’s equity + non-controlling interest |
|
Return on equity, % |
= |
Result for the period x100 Total equity (average of the figures for the accounting period) |
|
Average number of employees |
= |
The average number of employees at the end of previous financial year and of each calendar month during the accounting period |
|
Earnings / share, basic |
= |
Result for the financial year (attributable for equity holders) – hybrid capital expenses and accrued unrecognised interests after tax Weighted average number of shares outstanding during the period |
|
Earnings / share, diluted |
= |
Result for the financial year (attributable for equity holders) – hybrid capital expenses and accrued unrecognised interests after tax Weighted average number of shares, dilution adjusted |
|
Equity per share |
= |
Shareholders’ equity Number of outstanding shares at the end of the period |
|
Dividend per share |
= |
Dividend per share for the period Adjustment ratios of share issues during the period and afterwards |
|
Dividend per earnings (%) |
= |
Dividend per share x 100 Earnings per share |
|
Effective dividend yield (%) |
= |
Dividend per share x 100 Share price on December 31 |
|
Price/earnings ratio (P/E ratio) |
= |
Share price on December 31 Earnings per share |
|
Average price |
= |
Total EUR value of all shares traded Average number of all shares traded during the accounting period |
|
Market capitalisation |
= |
(Number of shares – treasury shares) x share price on the closing date |
|
Share turnover |
= |
Number of shares traded during the accounting period |
|
Share turnover (%) |
= |
Number of shares traded x 100 Average number of outstanding shares |
|
Organic growth |
= |
Defined as the change in revenue in local currencies excluding the impacts of (i) currencies; and (ii) acquisitions and divestments. The currency impact shows the impact of changes in exchange rates of subsidiaries with a currency other than the euro (Group’s reporting currency). The acquisitions and divestments impact shows how acquisitions and divestments completed during the current or previous year affect the revenue reported. |
* Items affecting comparability (IAC) are material items or transactions, which are relevant for understanding the financial performance of Caverion when comparing the profit of the current period with that of the previous periods. These items can include (1) capital gains and/or losses and transaction costs related to divestments and acquisitions; (2) write-downs, expenses and/or income from separately identified major risk projects; (3) restructuring expenses and (4) other items that according to Caverion management’s assessment are not related to normal business operations.
Adjusted EBITDA is affected by the same adjustments as adjusted EBITA, except for restructuring costs, which do not include depreciation and impairment relating to restructurings.